Oops! Something went wrong while submitting the form.
CRM analytics and performance tracking help businesses measure sales results, understand customer behavior, and make better data-driven decisions.
This blog explains what CRM metrics are, how to track them, and how CRM dashboards simplify performance tracking for sales and marketing teams.
What is a CRM metric?
CRM Metric/ noun /CRM
A CRM metric refers to any quantitative value stored that helps you evaluate your team’s sales performance. These metrics include win rate, average deal size, churn, and a healthy sales pipeline.
For instance, Superleap CRM tracks metrics like win rate, deal size, and pipeline coverage automatically, helping teams monitor results in real time.
Why CRM metrics matter (and a couple of numbers to prove it)
There are three broad advantages to tracking your CRM metrics: faster decisions, fewer dropped leads, and repeatable growth.
For context: Nucleus Research’s well-cited analysis found historically high ROI from CRM implementations (the famous “$8.71 returned per $1 spent” analysis), showing CRM can be a very high-leverage investment when implemented well.
Core CRM metrics: what to track, exactly (definitions + formulas)
CRM Metrics Flip Cards
1. Sales Performance Metrics
Leads Created
What it measuresNumber of new leads captured.
FormulaCount(lead_created_date within period)
CadenceDaily / Weekly
Why it mattersLeading indicator of future pipeline health.
MQL → SQL Conversion Rate
What it measures% of MQLs that become SQLs.
FormulaSQLs ÷ MQLs
CadenceWeekly / Monthly
Why it mattersMeasures lead quality and handoff alignment.
Lead-to-Customer Conversion Rate
What it measures% of leads that become customers.
FormulaCustomers ÷ Leads
CadenceMonthly / Quarterly
Why it mattersCore funnel efficiency metric.
Win Rate
What it measures% of opportunities won.
FormulaDeals won ÷ (won + lost)
CadenceWeekly / Monthly
Why it mattersSales effectiveness indicator.
Average Deal Size (ADS)
What it measuresMean value of closed deals.
FormulaTotal value ÷ # of won deals
CadenceMonthly / Quarterly
Why it mattersSignals pricing and discount health.
Sales Cycle Length
What it measuresAvg time from opportunity to close.
FormulaClose date − create date
CadenceMonthly / Quarterly
Why it mattersLong cycles slow revenue velocity.
Pipeline Coverage
What it measuresPipeline value vs target.
FormulaPipeline ÷ target
CadenceWeekly
Why it mattersPredicts quota attainment.
Quota Attainment
What it measures% reps hitting quota.
FormulaReps at quota ÷ total reps
CadenceMonthly / Quarterly
Why it mattersIndicates team health and forecast accuracy.
2. Lead & Marketing Metrics
Lead Response Time
What it measuresTime to first contact.
FormulaContact time − lead create time
CadenceDaily / Weekly
Why it mattersSpeed materially improves conversion.
Cost Per Lead (CPL)
What it measuresMarketing spend per lead.
FormulaTotal spend ÷ leads
CadenceMonthly
Why it mattersOptimises channel efficiency.
MQL Volume
What it measures# of marketing-qualified leads.
Formula—
CadenceWeekly / Monthly
Why it mattersTop-of-funnel health indicator.
3. Revenue & Financial Metrics
Customer Acquisition Cost (CAC)
What it measuresCost to acquire a customer.
Formula(Sales + Marketing) ÷ customers
CadenceMonthly / Quarterly
Why it mattersEfficiency benchmark vs LTV.
Customer Lifetime Value (LTV)
What it measuresTotal expected customer revenue.
FormulaARPA × margin ÷ churn
CadenceQuarterly
Why it mattersDrives sustainable growth.
Churn Rate
What it measures% customers lost.
FormulaLost ÷ starting customers
CadenceMonthly
Why it mattersUrgent retention signal.
4. Customer Success & Support Metrics
First Contact Resolution (FCR)
What it measures% issues resolved on first contact.
Formula—
CadenceWeekly / Monthly
Why it mattersEfficiency & satisfaction indicator.
CSAT / NPS
What it measuresCustomer happiness & loyalty.
Formula—
CadenceQuarterly
Why it mattersEarly churn-risk signal.
Time to Resolution (TTR)
What it measuresAvg time to close a ticket.
Formula—
CadenceWeekly / Monthly
Why it mattersImproves customer experience.
5. Data Hygiene & Operational Metrics
Duplicate Rate
What it measures% duplicate records.
Formula—
CadenceMonthly
Why it mattersCorrupts reporting & workflows.
Data Completeness Score
What it measures% required fields populated.
Formula—
CadenceMonthly
Why it mattersEnables segmentation & automation.
What is a CRM dashboard?
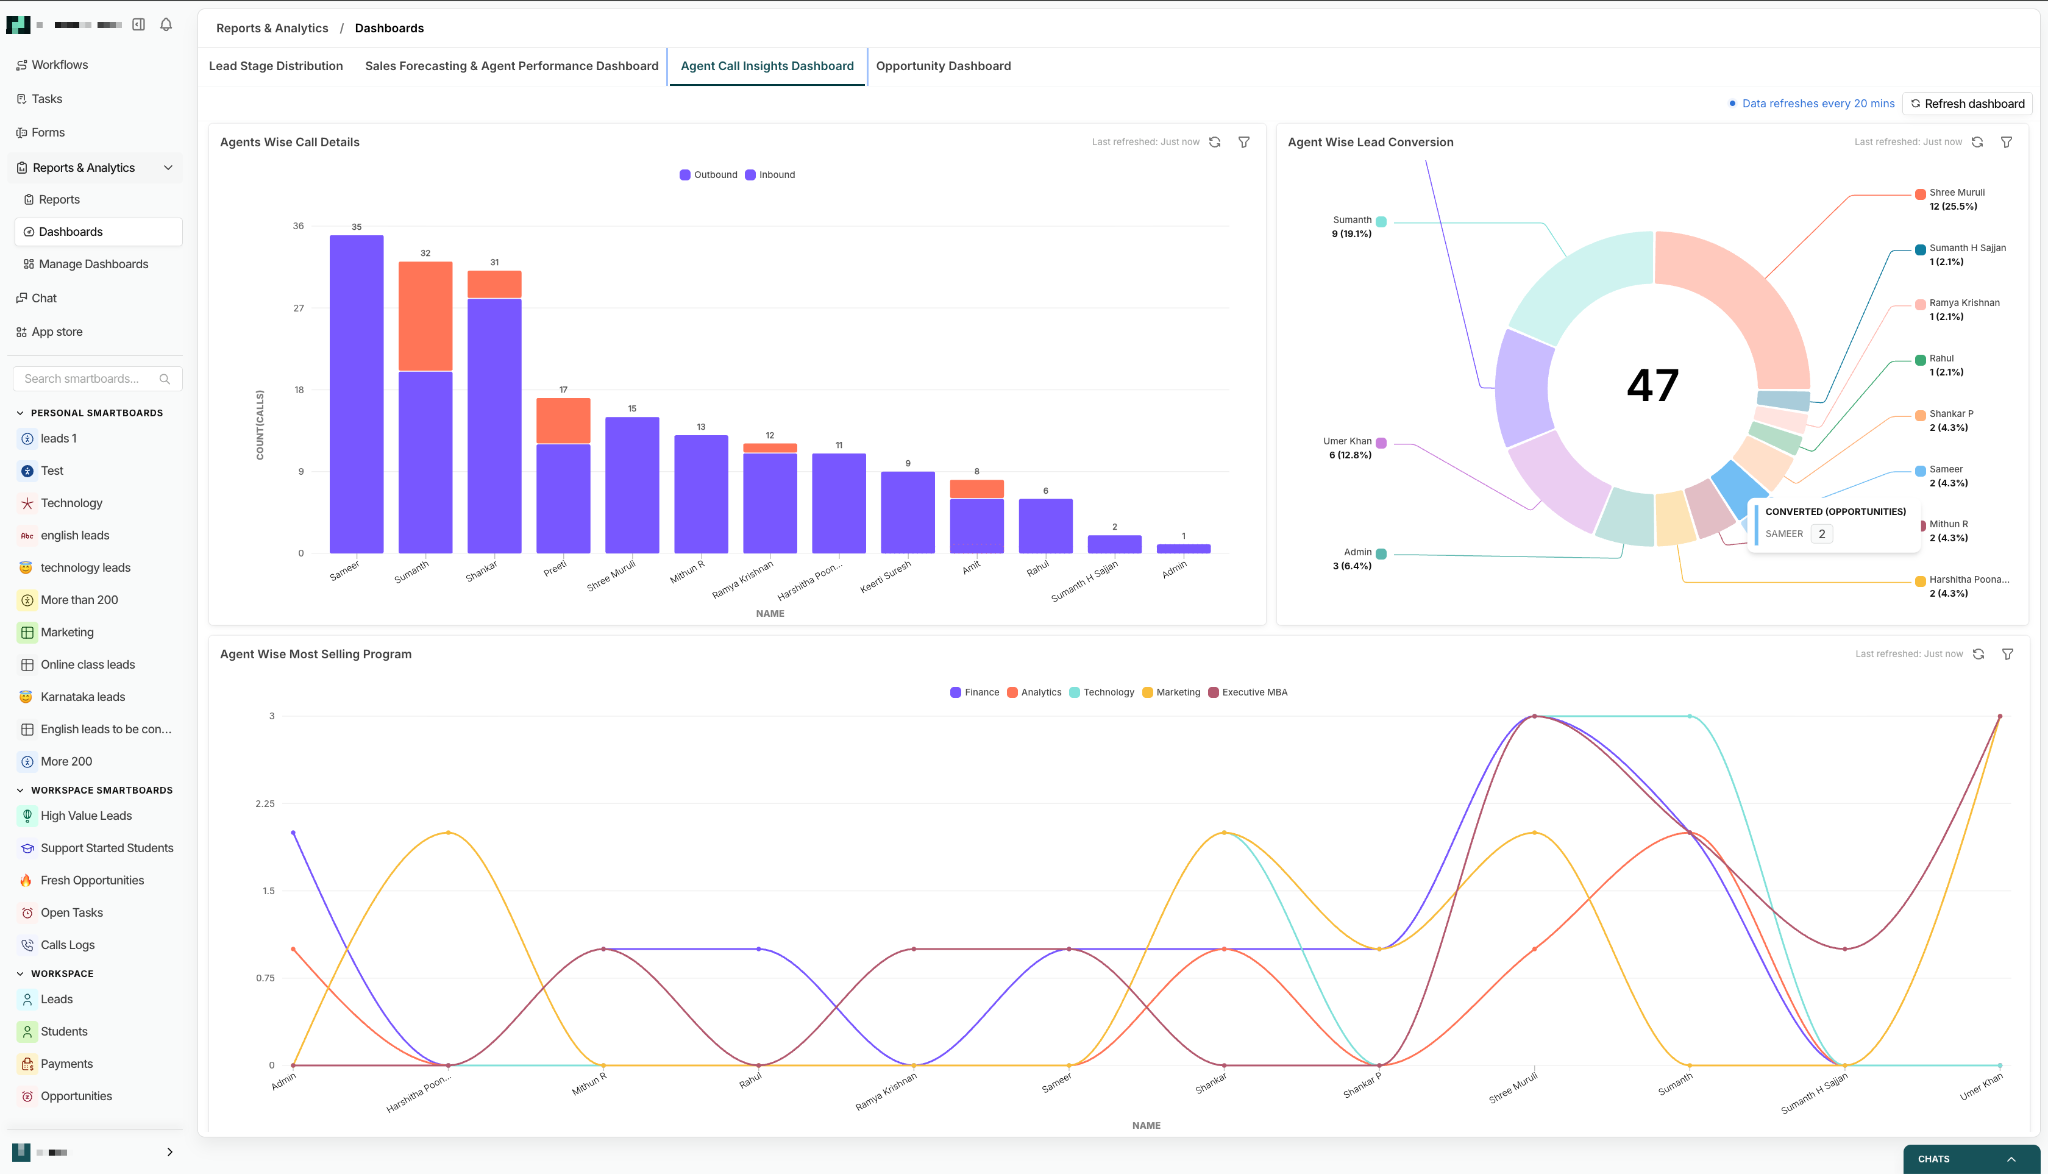
A CRM dashboard is a visual interface that brings all CRM metrics together, helping teams track performance across sales, marketing, and customer service. They make tracking performance easier by displaying live data on one screen.
These visuals look like charts, graphs, and key figures often arranged in 5-7 ‘widgets’ or cards representing trend lines, funnels, leaderboards, and alerts.
For example, Superleap’s CRM dashboard highlights pipeline movement, rep performance, and conversion trends instantly.
It is also worth noting that CRM dashboards are highly customizable. The metrics are designed for the person viewing it. A CEO dashboard can have revenue trends and growth rates while a sales manager’s can show individual rep performance & pipeline health.
What are the benefits of a CRM dashboard?
Centralized Data Access: All the data from multiple sources is aggregated and accessible in one single dashboard. This immediate visibility saves your time from juggling spreadsheets and reports.
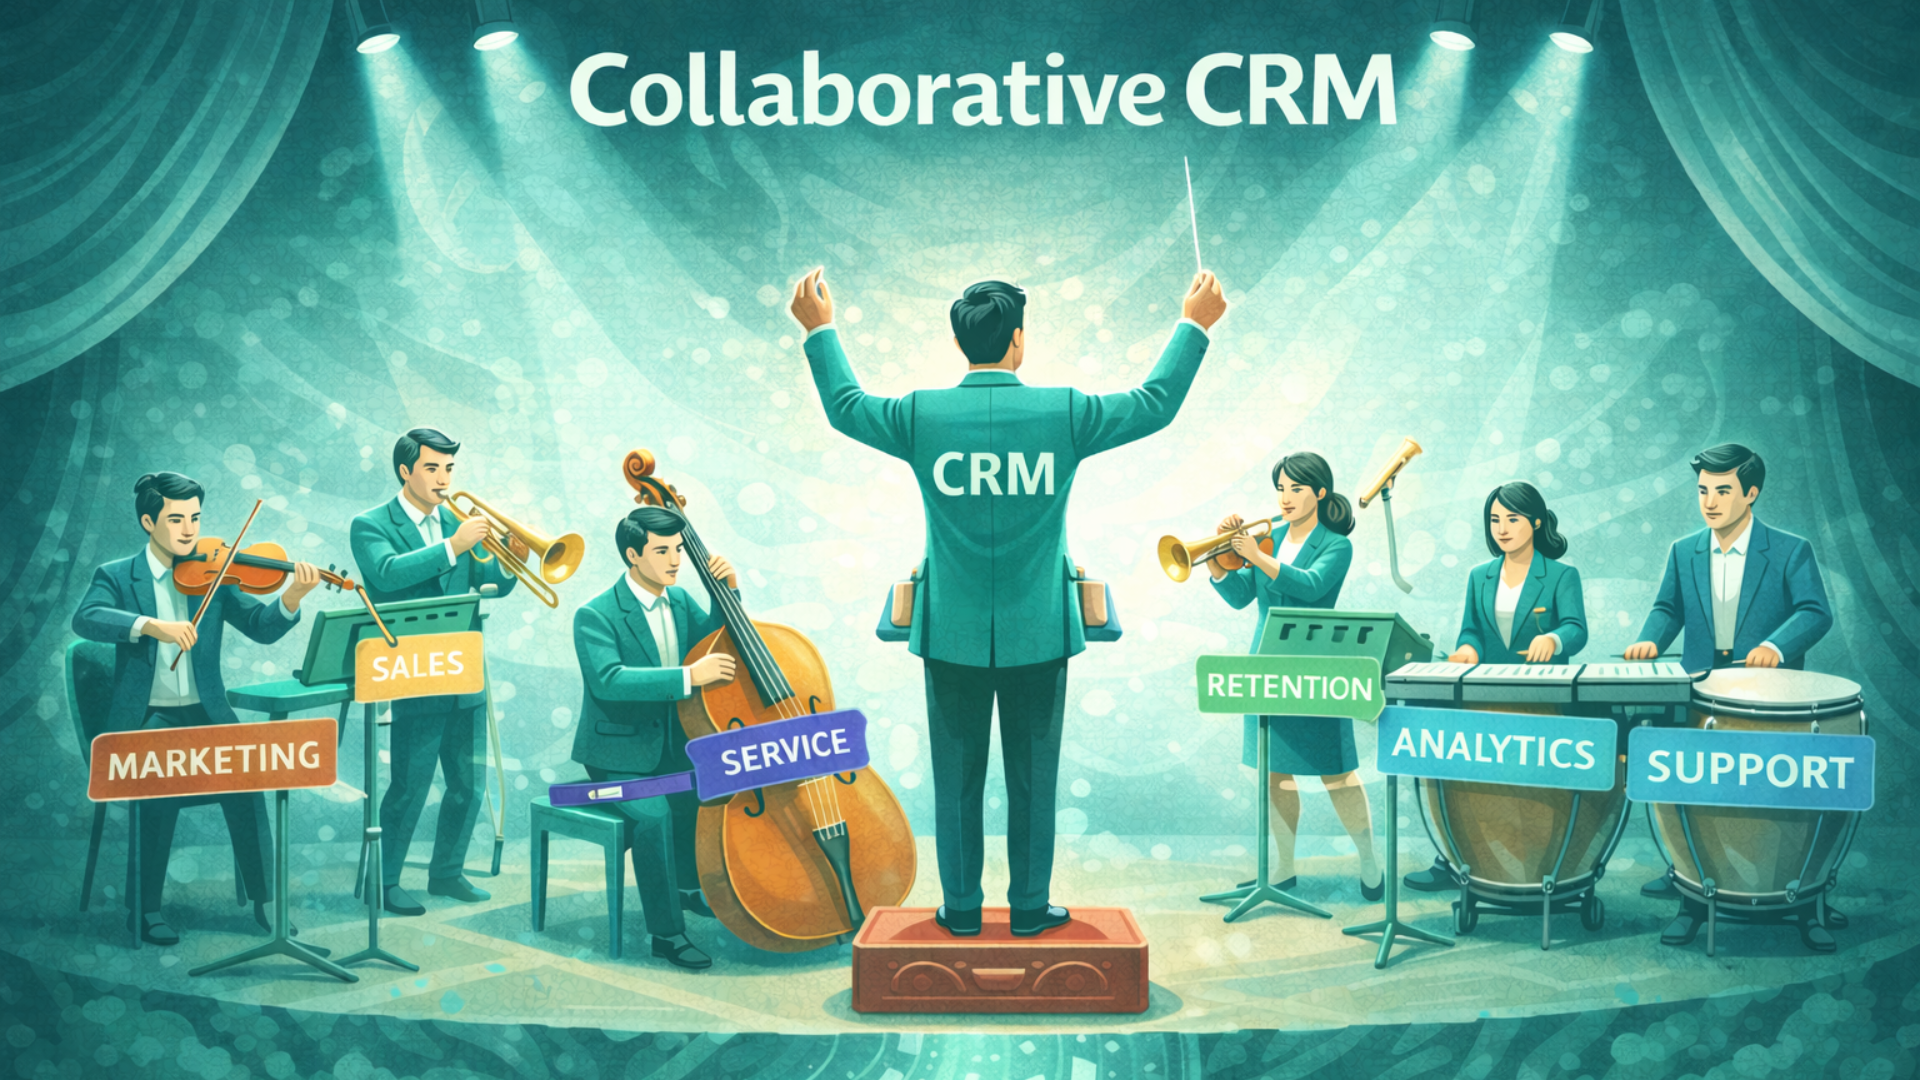
Alignment & Accountability: When every team member views the same data, they stay aligned. Sales knows what leads marketing brings in, marketing sees if leads are converting, and the customer success teams monitor churn rates - all enforcing transparency. This shared view promotes accountability and collaboration.
Real-Time Monitoring: CRMdashboards update on a daily basis, so, if yesterday your sales were higher or lower than expected, you can see it immediately, and make quick decisions.
Superleap dashboard
Tools & tech stack
Use the CRM’s native dashboards for operational, real-time needs (activity, pipeline, rep leaderboards). Native dashboards are easiest to update and typically integrate with your workflows. Examples: Superleap.
Use BI tools (Tableau, Power BI, Looker, Mode, Databox) for complex cross-system reports, advanced attribution, or finance-grade forecasting. BI tools are great when you need to blend CRM data with billing, product, and ad platforms.
Often the best approach is a hybrid: operational dashboards in the CRM for day-to-day work, and an executive BI dashboard for strategic, cross-functional metrics.
Conclusion
Picking the right CRM metrics to measure is crucial to the success of a business. When chosen correctly, a dashboard view facilitates quick and smart decision making.

.jpg)


.jpg)
.svg)
.svg)
.svg)
.svg)